
BuildRunKit Projects Dashboard Overview
GoldilocksBuildRunKit Projects: Projects Dashboard
Managing Your Workspace
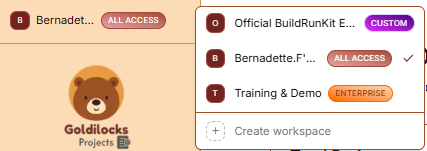
At the very top of the left sidebar, you will see your current workspace name. BuildRunKit allows you to manage multiple project environments from a single account.
How to Switch Workspaces:
-
ClickToptheLeftWorkspaceAction:Selector:<-ClickBackonbuttontheto return to main workspacename at the top of the sidebar.navigation. -
SelectModulefromViews:theList: -
ADashboard
dropdown(CurrentlymenuActive)will
Projects
Milestones
Tasks
Activity specificLog
Bottom Sidebar Links: Settings, Feedback, User Manual, Help & Support.
Header Actions
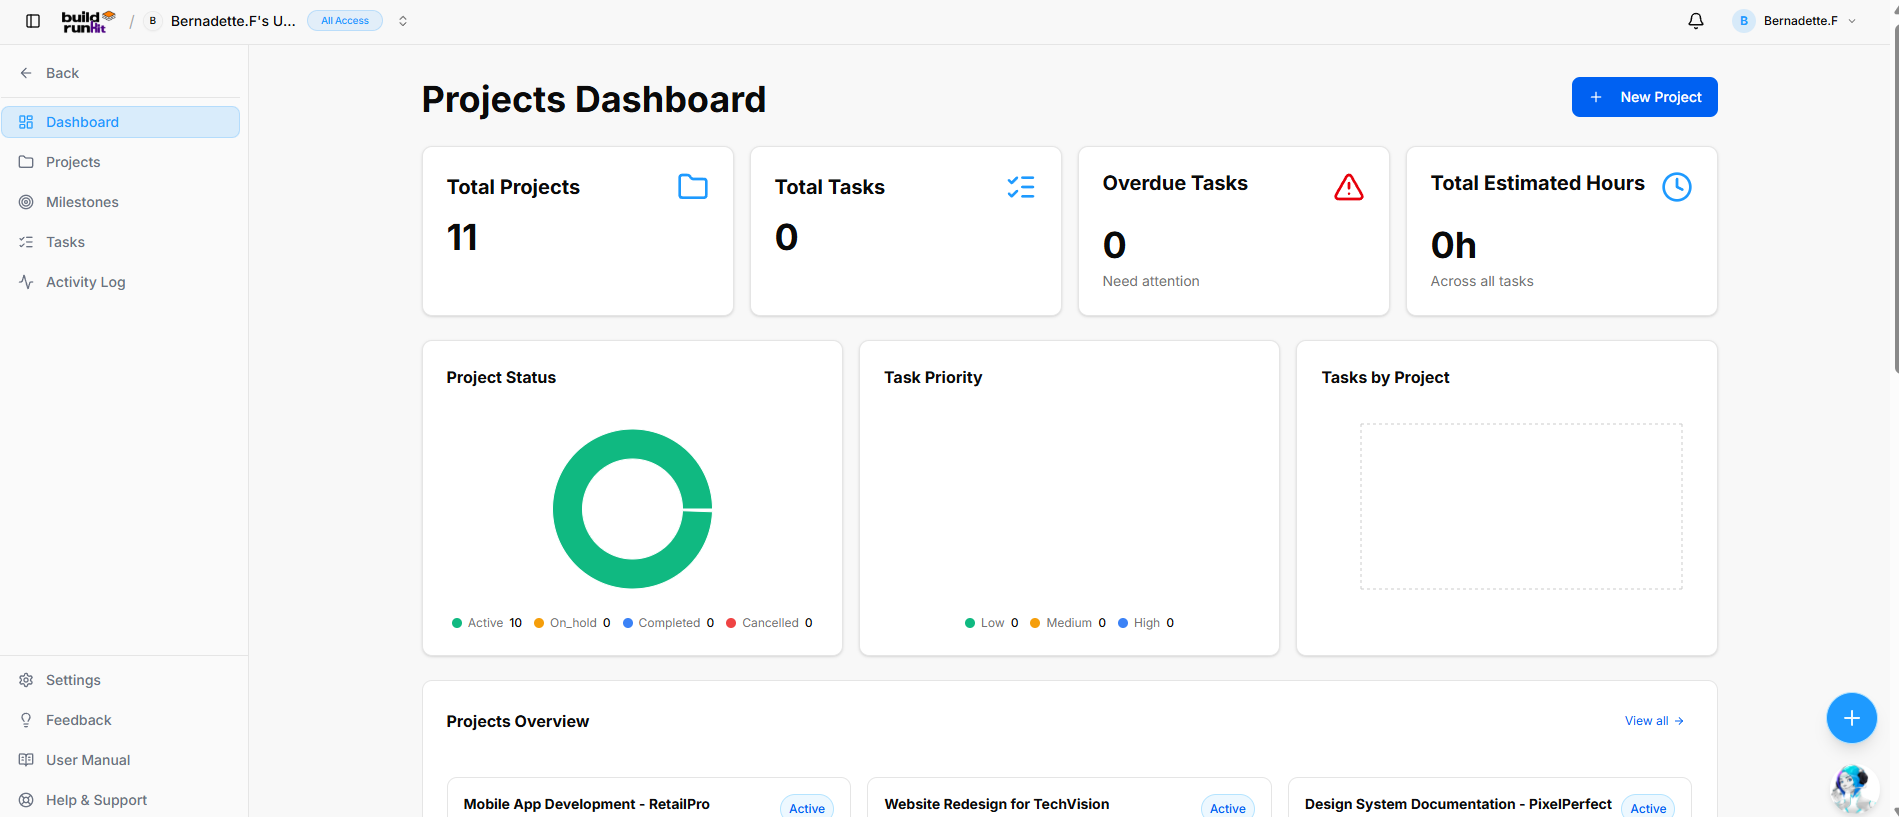
Page Title: Projects Dashboard
Primary Action: + New Project button.
Top Metric Cards
Total Projects: Displays total workspace projects (e.g., "Official BuildRunKit..." with a CUSTOM tag or "Training & Demo" with an ENTERPRISE tag)11).
InstantTotal Switch:Tasks: ClickTracks onoverall thetask desiredcount nameacross to instantly switch all project dataprojects (Tasks,e.g., Milestones, and Activities) to that workspace.0).
CreateOverdue New:Tasks: YouHighlights canoverdue alsoitems clickneeding attention with alert icon (e.g., 0, "+Need Create workspace" at the bottom of this menu to start a brand new project environment.
Activity Overview Cards
The top cards provide a quick count of your latest synced data and task health:
Total Projects: Shows the total count of active projects and an overall completion percentage.attention").
Total Tasks:Estimated DisplaysHours: theTracks total numberestimated ofduration tasks(e.g., in0h, the"Across workspaceall andtasks").
Analytics finished.& Visual Chart Panels
Project Status: Donut chart breaking down project states (Active, On_hold, Completed, Cancelled).
OverdueTask Tasks:Priority: HighlightsDistribution thechart numbermonitoring oftask tasksurgencies that(Low, haveMedium, passed their due dates and "Need attention."High).
UpcomingTasks Deadlines:by TracksProject: tasksVisual thatbreakdown arechart scheduledmapping totask bevolume completedacross withinindividual the current week.projects.
Projects
Quick Action Sections
-
RecentSectionProjects:Header:ThisProjectssectionOverviewdisplayswithyourViewmostallrecently->accessedquickprojects. If you are just starting, click the brown "Create Project" button in the center of the dashboard to begin your first workflow.link. -
ViewProjectAll:Cards:ClickGridthepreview"ViewshowingAll →" link to see a full list of everyactive projectintitlesyourandworkspace.status badges (e.g., Mobile App Development - RetailPro, Website Redesign for TechVision, Design System Documentation - PixelPerfect).
Task
Interactive& GanttActivity Charts
Feed The(Lower Projects module includes a visual Gantt chart timeline view to trace schedules and dependencies:Dashboard)
-
StructuralOverdueHierarchyTasksMapping:Panel:TheDedicatedtimelinelistchartbox displaying urgent past-due items (displaysthe"Nostructuraldatarelationshipavailable"between/high-level"CreateProjects,yourintermediatefirstMilestones,taskandtospecificgetTasks.started" when clear). -
Inline DetailsTasks Panel:Access:GeneralSelectingtaskorassignmentclickingfeedany(displaysvisual"Nobartasksoryet"block/inside"CreatetheyourGanttfirstchart view immediately opens its data details panel and editing interface.
Navigation Sidebar
Dashboard: Returns you to this overview page.clear).
Projects:Recent ViewActivity andSection:
Section listTitle of& ongoingCounter: andRecent archivedActivity projects.badge (e.g., 1).
Milestones:View TrackAll majorLink: goalsView andall roadmap-> targets.shortcut to the full log.
Tasks:Activity AccessLog yourTable fullColumns:
Event: manageAction individualtype to-dos.(e.g., Project created badge).
Activities:Project: View a logName of recentthe updatesassociated andproject changesrecord.
User: Team member who performed the workspace.action.
Date: Timestamp of the event (e.g., 2026-05-13).