
Market Research Stage
Market Research Stage
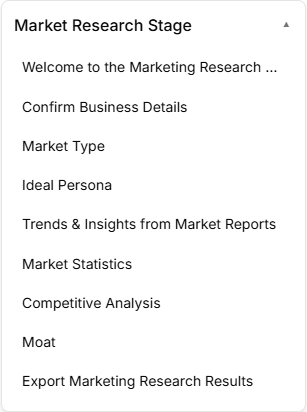
Sub-Stage 1: Welcome to the Marketing Research Stage
This sub-stage serves as the entry portal for the Market Research phase, shifting the founder's focus from internal discovery to external market dynamics. It establishes the framework for collecting objective market data, detailing ideal customer personas, tracking statistics, and analyzing industry competitive landscapes.
Canvas Layout & Workspace Components
-
Main Workspace Title: Displays "Welcome to the Marketing Research Stage" with an orienting subtitle: “Get an overview of the Market Research process and learn how this stage will help you identify your target market, trends, and competitors.”
Navigation Controls
Sub-Stage 1: Welcome to the Marketing Research Stage

This sub-stage screen serves as the introductory gateway to the market analysis phase, ensuring the founder has clear instructional media and overview tools before deep-diving into target consumer metrics.
Canvas Layout & Workspace Components
-
Main Workspace Title: Displays "Welcome to the Marketing Research Stage" accompanied by a directional subtitle: “Get an overview of the Market Research process and learn how this stage will help you identify your target market, trends, and competitors.”
-
Market Research Media Panel: Features a large central workspace graphic or video element titled Market Research on the top-left and branded directly with the official buildrunkit logo on the top-right.
-
Onboarding Information Drawer (Right Panel): A structured information block or layout component sits to the right of the media display to outline immediate objectives before the founder begins editing data entries.
Navigation Controls
-
Next Button: A blue Next → link utility button is centered at the bottom of the interface window to save the initialization state and advance the user directly to Sub-Stage 2 (Confirm Business Details).
Sub-Stage 2: Confirm Business Details
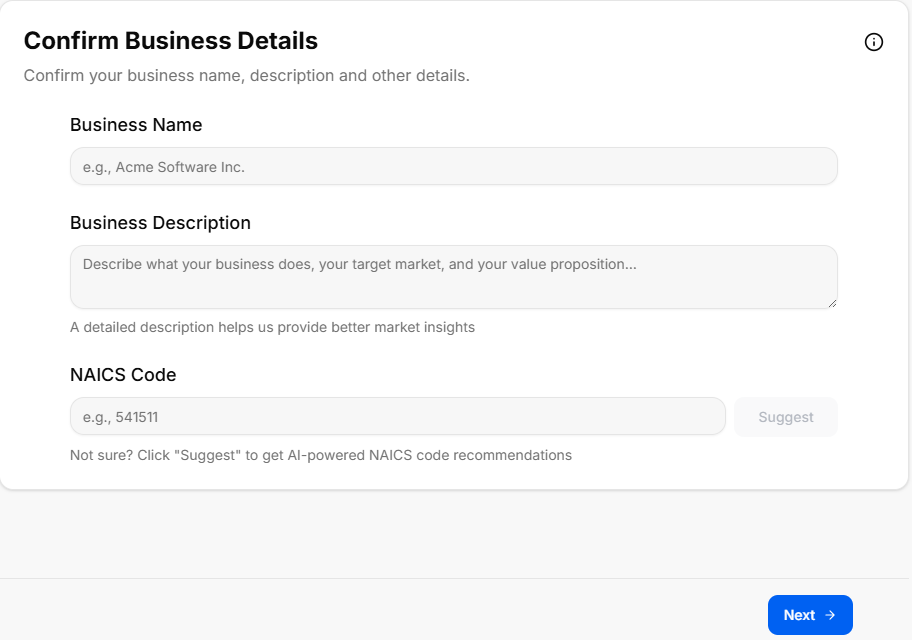
This sub-stage serves as a data verification screen where the user reviews and confirms the foundational business parameters established during the Discovery Stage before launching deep market research operations.
Canvas Layout & Workspace Components
-
Main Workspace Title: Displays "Confirm Business Details" accompanied by a clear instructional subtitle: “Please confirm your business details to ensure the market research is tailored accurately to your concept.”
-
Core Business Configuration Panel: A unified data entry card containing three structured verification fields:
-
1. Business Working Name:
-
Label: “Working Name”
-
Input Box: A text container designed to dynamically pull forward or allow editing of the company name.
-
-
2. Business Slogan:
-
Label: “Slogan”
-
Input Box: A secondary text container showing the established tagline or brand hook.
-
-
3. Business Core Description:
-
Label: “Description”
-
Input Box: A multi-line text container mapping out the specific workflow, target users, and key offerings of the business concept.
-
-
Navigation Controls
Sub-Stage 3: Market Type
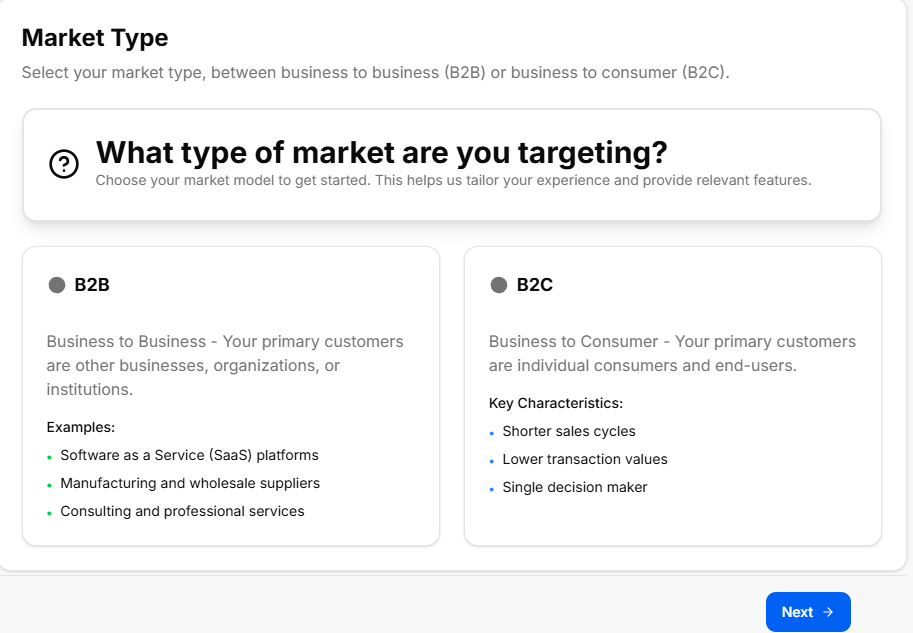
This sub-stage screen helps the founder identify, define, and select their foundational market entry strategy. Categorizing the market type changes how the system configures customer acquisition metrics, scaling speeds, and competitive positioning strategies later in the roadmap.
Canvas Layout & Workspace Components
-
Main Workspace Title: Displays "Market Type" accompanied by a targeted operational subtitle: “Identify the type of market you are entering to better understand consumer behaviors, regulatory barriers, and market dynamics.”
-
Market Type Matrix Selection: A collection of four large, interactive option cards arranged across the canvas. Each strategy type features a distinctive heading title and description block:
-
Existing Market:
-
Description: Entering an existing market with well-defined product categories, established competitors, and known customer requirements. The primary operational goal here is stealing market share from current incumbents.
-
-
New Market:
-
Description: Creating an entirely new market category where a product or service solves a problem that customers didn't realize they had. This path features no direct initial competitors but requires massive consumer education efforts.
-
-
Resegmented Market (Niche / Low Cost):
-
Description: Finding a specific group of customers in an existing market whose needs are currently ignored or underserved by massive industry giants. This relies on targeting a specific niche or leveraging a low-cost pricing strategy.
-
-
Clone Market:
-
Description: Taking an incredibly successful, proven business model from a foreign or distinct market and completely replicating it within a local region or unserved geographic area.
-
-
Navigation Controls
-
Next Button: A blue Next → action link utility button is anchored at the bottom right corner of the footer frame to lock down the chosen entry strategy and transition directly into Sub-Stage 4 (Ideal Persona).
Sub-Stage 4: Ideal Persona
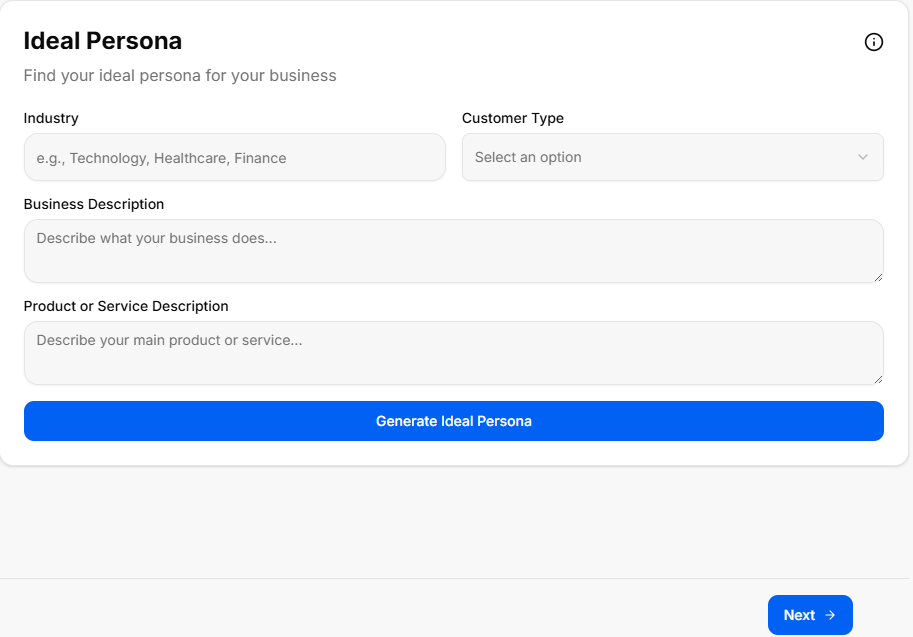
This sub-stage screen functions as a comprehensive buyer persona development center. It uses the verified business description and market choices to generate deep biographical profiles of the business's ideal targets, mapping their behaviors, professional constraints, and software requirements.
Canvas Layout & Workspace Components
-
Main Workspace Title: Displays "Ideal Persona" accompanied by a tactical user-experience subtitle: “Define your target audience profiles or user personas to deeply understand their backgrounds, key pain points, and specific needs.”
-
Persona Generation Control Card: A full-width configuration banner positioned at the top of the canvas layout:
-
Header: Generate Ideal Persona
-
Subtitle Text: “Generate an ideal user persona based on your business description and market choices to target the right customers.”
-
Action Button: A solid blue button centered below the descriptive text labeled Generate Ideal Persona. Clicking this parses the cumulative journey parameters to build targeted consumer case studies across the grid below.
-
The Generated Persona Matrix Grid
Once populated, the workspace layout organizes user attributes into four distinct, easy-to-read qualitative profiling blocks:
-
1. Profile & Demographics (User Icon):
-
Label: "1. Profile & Demographics"
-
Data Field: Displays the persona's core bio traits, including typical age brackets, job titles, daily professional environments, educational backgrounds, and income ranges.
-
-
2. Psychographics & Behaviors (Heart Icon):
-
Label: "2. Psychographics & Behaviors"
-
Data Field: Maps internal driving values, technology adoption habits, buying motivations, brand loyalties, and preferred digital communication channels.
-
-
3. Pain Points & Challenges (Warning Icon):
-
Label: "3. Pain Points & Challenges"
-
Data Field: Identifies critical friction points, systemic workplace bottlenecks, financial leaks, and personal operational frustrations the consumer actively seeks to solve.
-
-
4. Goals & Desired Outcomes (Target Icon):
-
Label: "4. Goals & Desired Outcomes"
-
Data Field: Highlights definition-of-success metrics, core productivity targets, long-term personal milestones, and specific software performance desires.
-
Navigation Controls
Sub-Stage 5: Trends & Insights from Market Reports
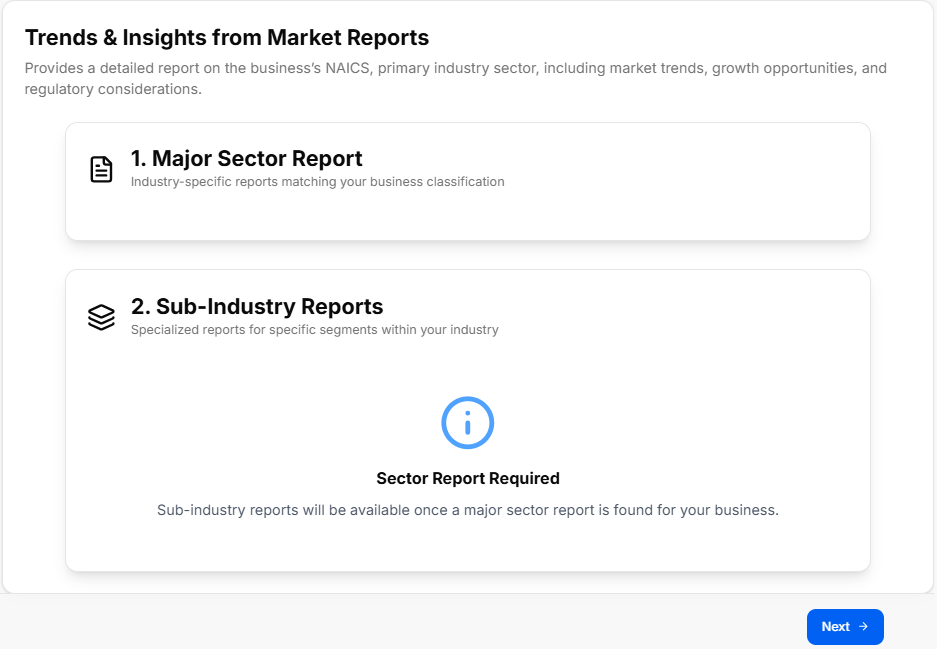
This sub-stage screen serves as an advanced trend analysis module. It processes the confirmed business details and industry vertical classifications to generate comprehensive reports mapping out macro market shifts, growth directions, and technical disruptions.
Canvas Layout & Workspace Components
-
Main Workspace Title: Displays "Trends & Insights from Market Reports" accompanied by a research-driven subtitle: “Generate comprehensive market trends and insights based on your business description and market choices to stay ahead of the competition.”
-
Trends Generation Control Card: A full-width specialized action container placed at the top of the workspace:
-
Header: Generate Trends & Insights
-
Subtitle Text: “Generate market trends and insights from industry reports to uncover growth opportunities and key market dynamics.”
-
Action Button: A solid blue button centered below the instructions labeled Generate Trends & Insights. Clicking this runs the analysis engine to populate the thematic data grids below.
-
The Generated Strategic Insights Grid
The research engine categorizes industry macro data into four distinct quadrant-style information panels across the canvas layout:
-
1. Market Trends (Graph Line Icon):
-
Label: "1. Market Trends"
-
Data Field: Details shifting industry directions, overall sector momentum, emergent business models, and adoption velocities within the targeted industrial landscape.
-
-
2. Market Insights (Lightbulb Icon):
-
Label: "2. Market Insights"
-
Data Field: Delivers deeper qualitative breakthroughs, hidden workflow demands, under-the-radar sector anomalies, and strategic takeaways relevant to the concept.
-
-
3. Opportunities (Star Icon):
-
Label: "3. Opportunities"
-
Data Field: Flags immediate operational gaps, niche market expansions, unserved customer segments, and high-growth spaces left open by existing market competitors.
-
-
4. Threats & Challenges (Shield/Warning Icon):
-
Label: "4. Threats & Challenges"
-
Data Field: Maps incoming systemic barriers, pricing drops, changing regulatory standards, technological risks, and defensive moves from large industry incumbents.
-
Navigation Controls
Sub-Stage 6: Market Statistics
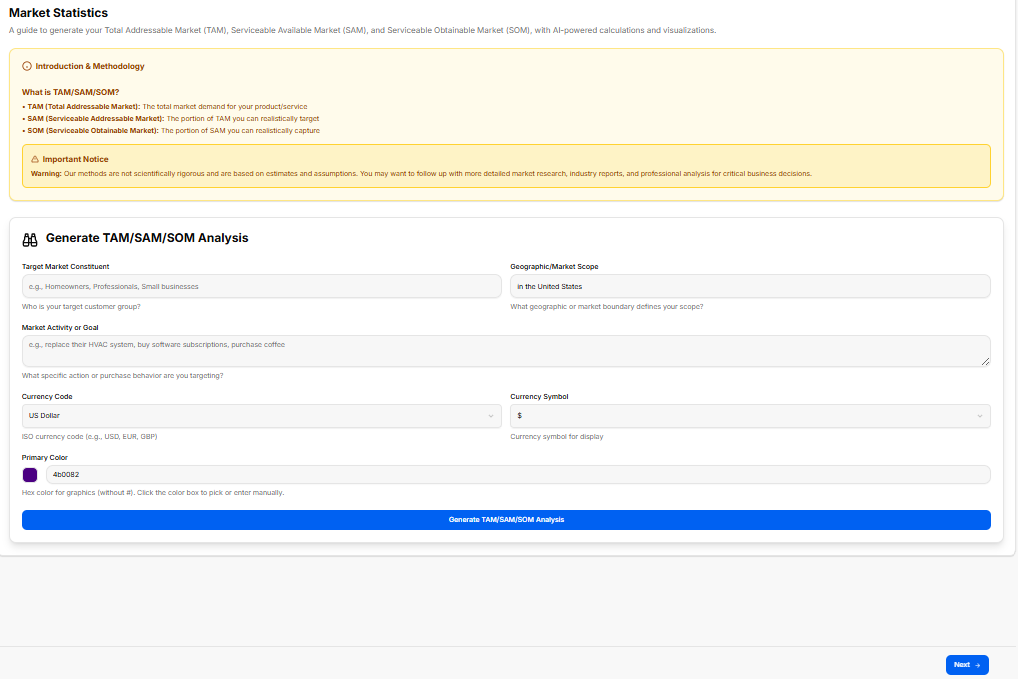
This sub-stage delivers a quantitative breakdown of the industry landscape. It processes the venture's target profile and NAICS industry classification to calculate addressable market sizes, industry growth percentages, and baseline customer acquisition metrics.
Canvas Layout & Workspace Components
-
Main Workspace Title: Displays "Market Statistics" accompanied by a metrics-focused subtitle: “View key market statistics and metrics to understand the scale, growth potential, and financial dynamics of your target industry.”
-
Statistics Generation Control Card: A full-width calculation container situated at the top of the workspace area:
-
Header: Generate Market Statistics
-
Subtitle Text: “Generate data-driven market statistics, including market sizing, growth rates, and average industry metrics to back your business strategy.”
-
Action Button: A solid blue button centered within the container labeled Generate Market Statistics. Clicking this runs the financial modeling engine to populate the quantitative panels below.
-
The Generated Market Metrics Grid
The reporting suite arranges the calculated industry benchmarks into four clear data visualization panels across the page layout:
-
1. Market Sizing (TAM, SAM, SOM) (Pie Chart Icon):
-
Label: "1. Market Sizing (TAM, SAM, SOM)"
-
Data Field: Pulls dynamic calculations for Total Addressable Market (TAM), Serviceable Addressable Market (SAM), and Serviceable Obtainable Market (SOM) to illustrate the absolute scale of the revenue opportunity.
-
-
2. Growth Rates & Projections (Bar Chart Icon):
-
Label: "2. Growth Rates & Projections"
-
Data Field: Tracks Compound Annual Growth Rate (CAGR) percentages, historical momentum, and five-year industrial trajectory forecasts.
-
-
3. Key Industry Metrics (Analytics Icon):
-
Label: "3. Key Industry Metrics"
-
Data Field: Outlines core operational baselines unique to the sector, such as standard profit margins, transaction volumes, and asset utilization averages.
-
-
4. Customer Acquisition Metrics (User Funnel Icon):
-
Label: "4. Customer Acquisition Metrics"
-
Data Field: Details industry standard Customer Acquisition Costs (CAC), expected Customer Lifetime Value (LTV) ratios, and average sales cycle lengths.
-
Navigation Controls
Sub-Stage 7: Competitive Analysis
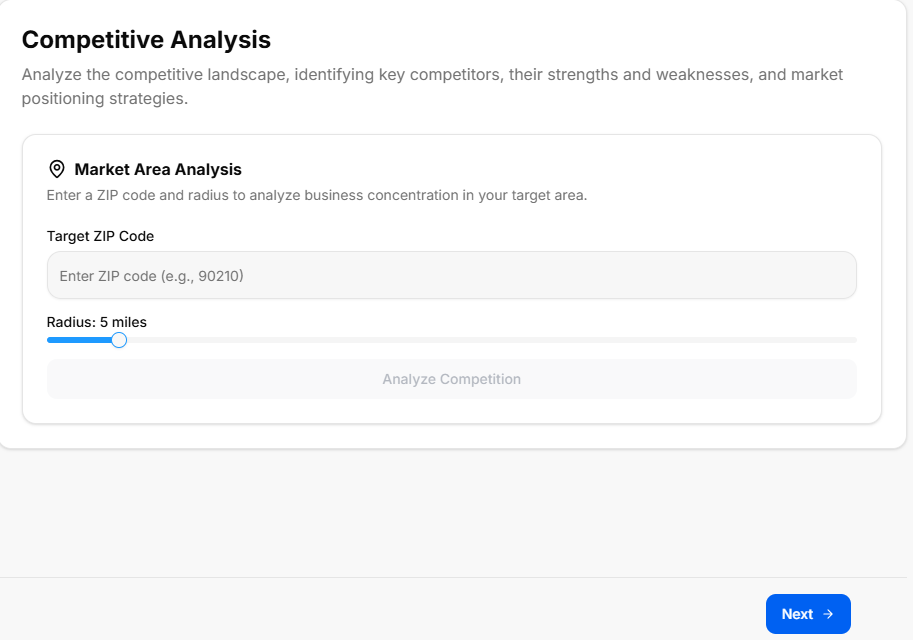
This sub-stage functions as an automated and manual benchmarking hub. It processes the company's core concept description and targeted market choices to systematically track direct and indirect market competitors.
Canvas Layout & Workspace Components
-
Main Workspace Title: Displays "Competitive Analysis" accompanied by a positioning subtitle: “Identify and analyze your competitors to understand their strengths, weaknesses, and market positioning.”
-
Competitor Generation Control Card: A full-width intelligence container positioned at the top of the canvas workspace:
-
Header: Generate Competitive Analysis
-
Subtitle Text: “Generate a comprehensive competitive analysis, profiling major competitors, their market share, strategies, and features.”
-
Action Button: A solid blue button centered within the container labeled Generate Competitive Analysis. Clicking this runs the analysis to populate the matrix blocks below.
-
The Generated Competitive Intelligence Grid
The system populates and segments competitive landscaping metrics into four standard tracking containers across the page layout:
-
1. Top Competitors Profile (Users Icon):
-
Label: "1. Top Competitors Profile"
-
Data Field: Displays the profiles and market data of primary competitors.
-
-
2. Competitor Strengths & Weaknesses (Shield Icon):
-
Label: "2. Competitor Strengths & Weaknesses"
-
Data Field: Displays the core strengths and critical weaknesses identified for each competitor.
-
-
3. Feature Comparison Matrix (Sliders/Settings Icon):
-
Label: "3. Feature Comparison Matrix"
-
Data Field: Displays a detailed breakdown of features across different market players.
-
-
4. Pricing & Market Positioning (Dollar Tag Icon):
-
Label: "4. Pricing & Market Positioning"
-
Data Field: Displays the pricing tiers and strategic market positioning of competitors.
-
Navigation Controls
-
Next Button: A blue Next → navigation action button is anchored at the bottom right-hand margin of the footer. Clicking this locks in the competitor tracking data and advances directly to Sub-Stage 8 (Moat).
Sub-Stage 8: Moat
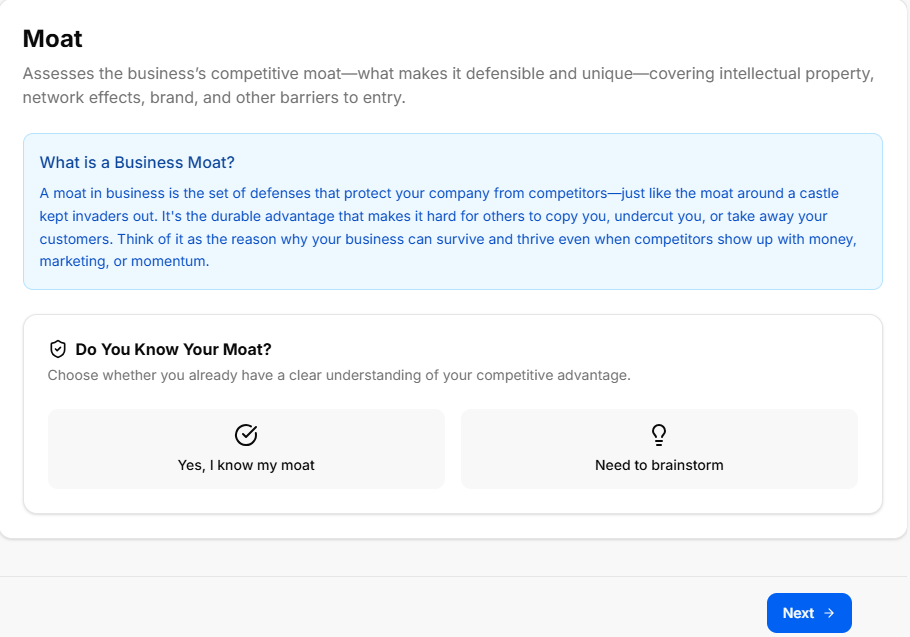
This sub-stage focusing on identifying and developing your venture's competitive advantages or "moat". Defining these core barriers helps secure your market position and protects your startup concept from being easily replicated by competitors.
Canvas Layout & Workspace Components
-
Main Workspace Title: Displays "Moat" accompanied by a protective strategy subtitle: “Identify and define your competitive advantages or 'moat' to protect your business from competitors and sustain long-term success.”
-
Moat Generation Control Card: A full-width strategic planning container positioned at the top of the canvas workspace:
-
Header: Generate Moat
-
Subtitle Text: “Generate a comprehensive moat analysis, profiling major barriers to entry, switching costs, and network effects.”
-
Action Button: A solid blue button centered within the container labeled Generate Moat. Clicking this runs the analysis to populate the defensive strategic blocks below.
-
The Generated Moat Analysis Grid
The system populates and segments your defensive market structures into four standard tracking containers across the page layout:
-
1. Barriers to Entry (Shield Icon):
-
Label: "1. Barriers to Entry"
-
Data Field: Displays the structural roadblocks and startup challenges that prevent new players from easily entering your space.
-
-
2. Switching Costs (Arrows Icon):
-
Label: "2. Switching Costs"
-
Data Field: Displays the calculated operational, financial, or psychological costs customers face if they try to leave your platform for a competitor.
-
-
3. Network Effects (Network/Nodes Icon):
-
Label: "3. Network Effects"
-
Data Field: Displays how your product or service naturally becomes more valuable to existing users as your total customer base grows.
-
-
4. Cost Advantages (Trending Down Bar Chart Icon):
-
Label: "4. Cost Advantages"
-
Data Field: Displays the unique operational efficiencies, scale economics, or proprietary processes that allow you to maintain lower costs than rivals.
-
Navigation Controls
-
Next Button: A blue Next → navigation action button is anchored at the bottom right-hand margin of the footer. Clicking this saves your competitive advantage profiles and advances directly to Sub-Stage 9 (Export Marketing Research Results).
Sub-Stage 9: Export Marketing Research Results
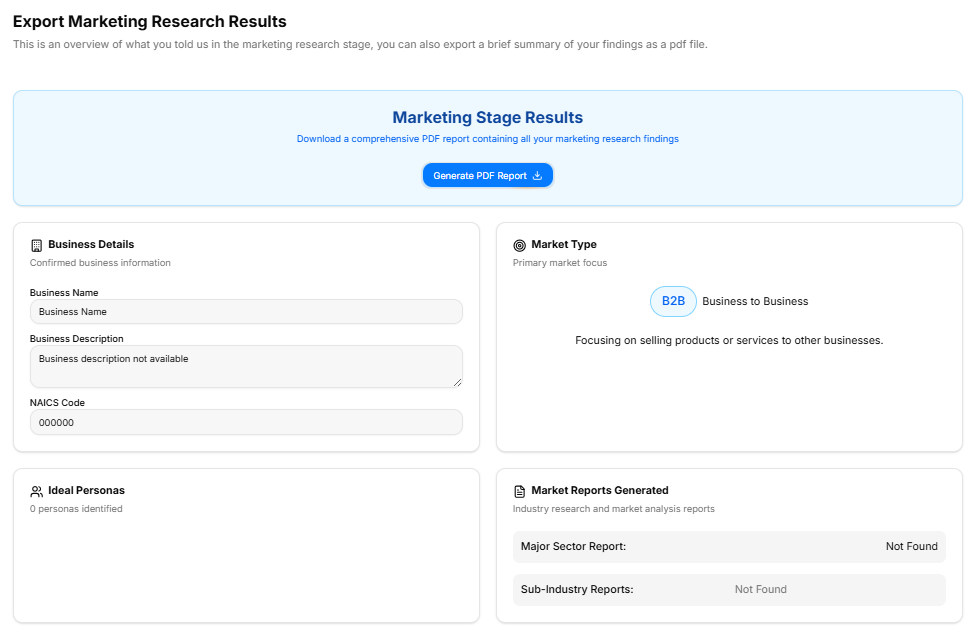
This final checkpoint compiles all inputs, strategy selections, and AI-generated analysis grids from the Market Research Stage into a centralized audit layout. It provides a read-only historical overview alongside comprehensive export features before unlocking progress into the next stage of development.
Canvas Layout & Workspace Components
-
Main Workspace Title: Displays "Export Marketing Research Results" accompanied by an instructional subtitle: “This is an overview of what you told us in the marketing research stage, you can also export a brief summary of your findings as a pdf file.”
-
Document Generation Panel: A full-width light-blue callout container positioned at the top of the canvas:
-
Description: Instructs the user to “Download a comprehensive PDF report containing all your marketing research findings”.
-
Action Button: Features a centered blue Generate PDF Report action key with an integrated download tray icon.
-
Core Market Settings Summary Grid (Upper Panel)
The top half of the summary layout utilizes a two-column grid framework to display foundational strategic choices:
-
Business Details Card:
-
Label: “Your confirmed business details”
-
Data Rows: Displays the verified company working name, brand slogan, and core concept description.
-
-
Market Type Card:
-
Label: “The market type classification for your business”
-
Data Field: Displays the chosen market entry strategy (e.g., Existing, New, Resegmented, or Clone).
-
-
Ideal Persona Card:
-
Label: “The target customer profile or user persona”
-
Data Field: Displays the generated customer demographic and psychographic profiles.
-
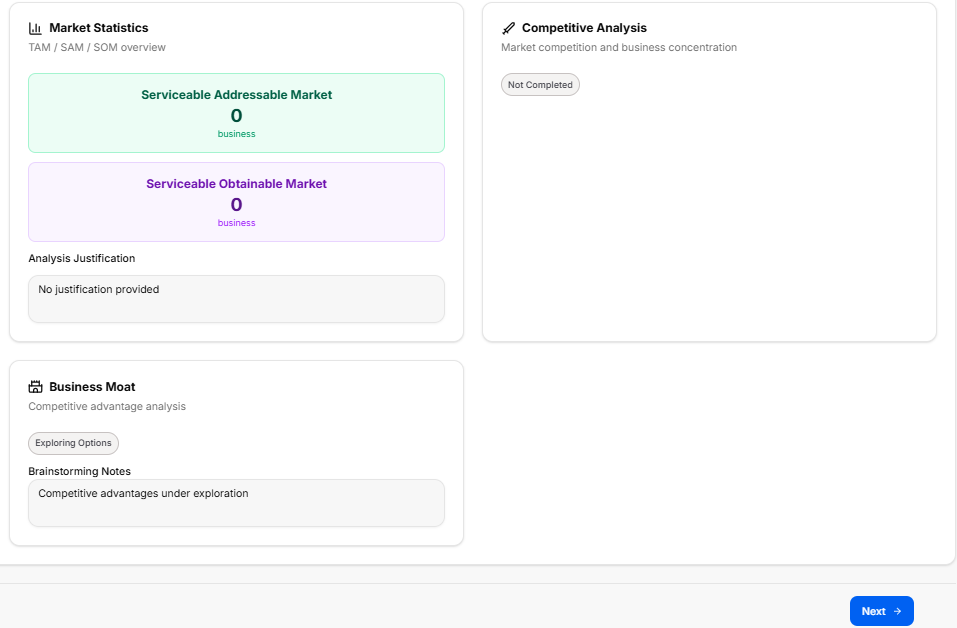
Deep Research Analysis Summaries (Lower Panel)
The bottom section handles the complex data models, industry trend forecasts, and competitive positioning metrics logged throughout the phase:
-
Trends & Insights Summary Block:
-
Header Title: Trends & Insights Summary
-
Label: “Key trends, insights, opportunities, and threats from industry reports”
-
Data Field: Displays the compiled macro-market directions and risk profiles.
-
-
Market Statistics Summary Block:
-
Header Title: Market Statistics Summary
-
Label: “Data-driven market statistics including sizing, growth rates, and metrics”
-
Data Field: Displays the quantitative industry benchmarks, size estimates, and growth calculations.
-
-
Competitive Analysis Summary Block:
-
Header Title: Competitive Analysis Summary
-
Label: “Profiles, strengths, weaknesses, and features of your top competitors”
-
Data Field: Displays the competitive intelligence profiles and positioning comparisons.
-
-
Moat Summary Block:
-
Header Title: Moat Summary
-
Label: “Your competitive advantages, barriers to entry, and network effects”
-
Data Field: Displays the identified defensive strategic barriers and switching cost advantages.
-